

Overview
Logs are your window into what’s happening inside your services. Ardor captures everything — from build output to runtime errors — so you can debug issues and monitor performance.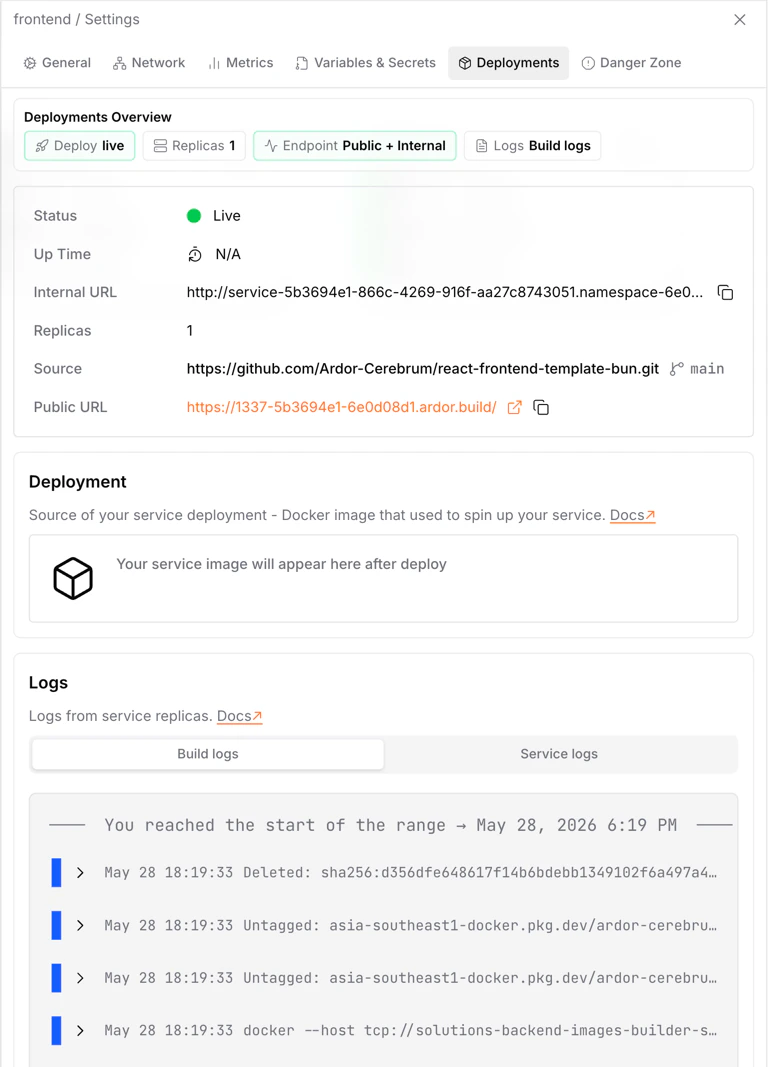
Log Types
Ardor provides two types of logs for each service:Build Logs
Docker build output — dependency installation, compilation, image creation
Runtime Logs
Production output — your app’s stdout/stderr while running in deployment
Build Logs
Build logs show everything that happens duringdocker build:
- Base image download
- Dependency installation (
npm install,pip install, etc.) - Code compilation
- Asset bundling
- Any commands in your Dockerfile
What to Look For
- Successful Build
- Failed Build
Common Build Errors
Package not found
Package not found
Dockerfile syntax error
Dockerfile syntax error
COPY failed: file not found
COPY failed: file not found
.gitignore.Out of memory
Out of memory
Runtime Logs
Runtime logs capture your app’s output while it’s running in production:stdout— normal output, print statements, info logsstderr— errors, warnings, exceptions- Framework logs — web server access logs, database queries, etc.
Reading Runtime Logs
- Healthy App
- App with Errors
Adding Useful Logs
Help yourself debug by adding structured logging:- Python
- Node.js
How Logging Works
Zero configuration required. Ardor automatically captures everything your app writes to
stdout and stderr. Just use print(), console.log(), or your favorite logging library — it all shows up in the logs.Debugging with Logs
Startup Issues
App won’t start? Check logs in this order:- Build logs — did the image build successfully?
- Runtime logs — is the app crashing on startup?
- Look for: missing env vars, connection errors, port conflicts
Request Failures
API returning errors? Look for:- Stack traces with line numbers
- Database query errors
- External API failures
- Timeout messages
Performance Issues
App slow? Look for:- Long-running queries logged with duration
- Memory warnings
- Connection pool exhaustion
- Rate limiting messages
Log Best Practices
Log at appropriate levels
Log at appropriate levels
- ERROR — something broke, needs attention
- WARN — something unusual, might be a problem
- INFO — normal operations, useful for tracking flow
- DEBUG — detailed info for debugging (usually disabled in production)
Include context
Include context
Bad:
"Error processing request"Good: "Error processing request user_id=123 endpoint=/api/orders error=ConnectionTimeout"Don't log secrets
Don't log secrets
Never log passwords, API keys, or tokens. Mask sensitive data in your logging code.
Use request IDs
Use request IDs
Generate a unique ID for each request and include it in all logs. Makes it easy to trace a request through your system.
Troubleshooting
No logs appearing
No logs appearing
Cause: App isn’t writing to stdout/stderr, or container isn’t running.Solution:
- Make sure your app logs to stdout, not to files
- Check if the container is actually running (deployment status)
- Verify your logging library is configured correctly
Logs cut off or missing
Logs cut off or missing
Cause: Very high log volume or app crashed before flushing.Solution:
- Reduce log verbosity in production
- Flush logs explicitly before app exit
- Check for app crashes in earlier logs
Can't find specific error
Can't find specific error
Cause: Too many logs, error buried.Solution:
- Use search/filter to narrow down
- Filter by time when the error occurred
- Search for keywords from the error message
What’s Next
Deployments
Understand the build and deploy process
Development Container
Test and debug in your dev environment
Variables & Secrets
Configure your app with environment variables
Build with Cerebrum
Let Cerebrum help you debug issues from logs