> ## Documentation Index
> Fetch the complete documentation index at: https://docs.ardor.cloud/llms.txt
> Use this file to discover all available pages before exploring further.
# Logging
> Monitor, debug, and understand your services with build logs and runtime logs.
## Overview
Logs are your window into what's happening inside your services. Ardor captures everything — from build output to runtime errors — so you can debug issues and monitor performance.
**Cerebrum reads logs for you.** Just say "why is my app crashing?" or "check the build logs" — Cerebrum will analyze logs and explain what's wrong. The details below help you understand logs yourself.
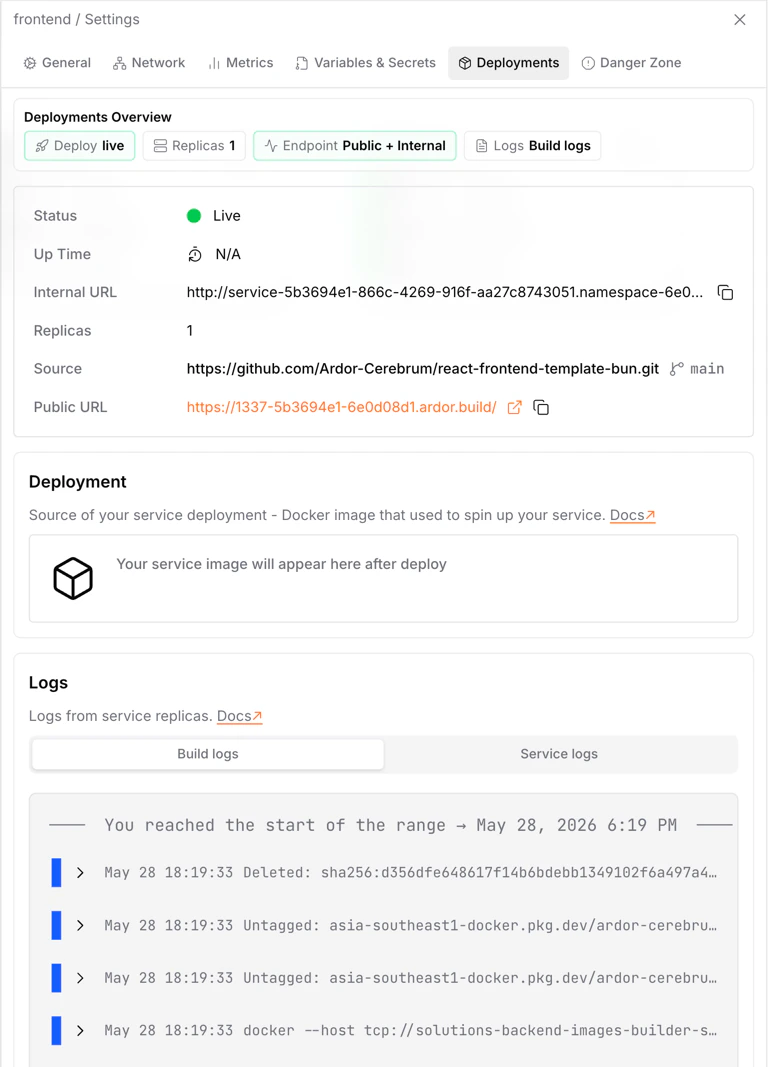 ## Log Types
Ardor provides two types of logs for each service:
Docker build output — dependency installation, compilation, image creation
Production output — your app's stdout/stderr while running in deployment
## Build Logs
Build logs show everything that happens during `docker build`:
* Base image download
* Dependency installation (`npm install`, `pip install`, etc.)
* Code compilation
* Asset bundling
* Any commands in your Dockerfile
### What to Look For
```
Step 1/8 : FROM python:3.12-slim
---> a2c7d3e8f9b1
Step 2/8 : WORKDIR /app
---> Running in 3f4a5b6c7d8e
Step 3/8 : COPY requirements.txt .
---> 1a2b3c4d5e6f
Step 4/8 : RUN pip install --no-cache-dir -r requirements.txt
---> Installing collected packages: flask, click, ...
Successfully installed flask-3.0.0 ...
Step 5/8 : COPY . .
---> 7g8h9i0j1k2l
Step 6/8 : EXPOSE 8080
Step 7/8 : CMD ["python", "app.py"]
Successfully built 3m4n5o6p7q8r
```
```
Step 4/8 : RUN pip install --no-cache-dir -r requirements.txt
ERROR: Could not find a version that satisfies the requirement
nonexistent-package==1.0.0
ERROR: No matching distribution found for nonexistent-package==1.0.0
The command '/bin/sh -c pip install...' returned a non-zero code: 1
```
**Fix:** Check that all packages in `requirements.txt` exist and versions are correct.
### Common Build Errors
```
ERROR: Could not find a version that satisfies the requirement xyz
```
**Fix:** Check package name spelling, version availability, or if it's in a private registry.
```
failed to solve: dockerfile parse error line X: unknown instruction
```
**Fix:** Check Dockerfile syntax. Common issues: typos, missing backslashes in multi-line commands.
```
COPY failed: file not found in build context
```
**Fix:** The file doesn't exist or isn't committed to git. Check the path and make sure it's not in `.gitignore`.
```
npm ERR! code ENOMEM
```
**Fix:** Build needs more memory. Try smaller base images or contact support for larger build instances.
## Runtime Logs
Runtime logs capture your app's output while it's running in production:
* `stdout` — normal output, print statements, info logs
* `stderr` — errors, warnings, exceptions
* Framework logs — web server access logs, database queries, etc.
### Reading Runtime Logs
```
INFO: Started server process [1]
INFO: Waiting for application startup.
INFO: Application startup complete.
INFO: Uvicorn running on http://0.0.0.0:8080
INFO: 192.168.1.1:0 - "GET /api/health HTTP/1.1" 200
INFO: 192.168.1.1:0 - "POST /api/users HTTP/1.1" 201
```
```
INFO: Application startup complete.
ERROR: Exception in handler:
Traceback (most recent call last):
File "/app/routes.py", line 42, in create_user
db.execute(query)
ConnectionRefusedError: Connection refused
ERROR: Database connection failed - is DATABASE_URL correct?
```
**Fix:** Check your `DATABASE_URL` environment variable and database service status.
### Adding Useful Logs
Help yourself debug by adding structured logging:
```python theme={null}
import logging
logging.basicConfig(
level=logging.INFO,
format='%(asctime)s - %(name)s - %(levelname)s - %(message)s'
)
logger = logging.getLogger(__name__)
logger.info("Starting user creation", extra={"user_id": user_id})
logger.error("Failed to connect to database", exc_info=True)
```
```javascript theme={null}
const logger = {
info: (msg, data) => console.log(JSON.stringify({ level: 'info', msg, ...data, ts: new Date() })),
error: (msg, data) => console.error(JSON.stringify({ level: 'error', msg, ...data, ts: new Date() }))
};
logger.info('Starting user creation', { userId });
logger.error('Database connection failed', { error: err.message });
```
Use structured logging (JSON format) for easier searching and filtering. Include context like user IDs, request IDs, and timestamps.
## How Logging Works
**Zero configuration required.** Ardor automatically captures everything your app writes to `stdout` and `stderr`. Just use `print()`, `console.log()`, or your favorite logging library — it all shows up in the logs.
```mermaid theme={null}
flowchart LR
A[Your Code] -->|stdout/stderr| B[Ardor Captures]
B --> C[Log Viewer]
```
## Debugging with Logs
### Startup Issues
App won't start? Check logs in this order:
1. **Build logs** — did the image build successfully?
2. **Runtime logs** — is the app crashing on startup?
3. Look for: missing env vars, connection errors, port conflicts
### Request Failures
API returning errors? Look for:
* Stack traces with line numbers
* Database query errors
* External API failures
* Timeout messages
### Performance Issues
App slow? Look for:
* Long-running queries logged with duration
* Memory warnings
* Connection pool exhaustion
* Rate limiting messages
## Log Best Practices
* **ERROR** — something broke, needs attention
* **WARN** — something unusual, might be a problem
* **INFO** — normal operations, useful for tracking flow
* **DEBUG** — detailed info for debugging (usually disabled in production)
Bad: `"Error processing request"`
Good: `"Error processing request user_id=123 endpoint=/api/orders error=ConnectionTimeout"`
Never log passwords, API keys, or tokens. Mask sensitive data in your logging code.
Generate a unique ID for each request and include it in all logs. Makes it easy to trace a request through your system.
## Troubleshooting
**Cause:** App isn't writing to stdout/stderr, or container isn't running.
**Solution:**
* Make sure your app logs to stdout, not to files
* Check if the container is actually running (deployment status)
* Verify your logging library is configured correctly
**Cause:** Very high log volume or app crashed before flushing.
**Solution:**
* Reduce log verbosity in production
* Flush logs explicitly before app exit
* Check for app crashes in earlier logs
**Cause:** Too many logs, error buried.
**Solution:**
* Use search/filter to narrow down
* Filter by time when the error occurred
* Search for keywords from the error message
## What's Next
Understand the build and deploy process
Test and debug in your dev environment
Configure your app with environment variables
Let Cerebrum help you debug issues from logs
## Log Types
Ardor provides two types of logs for each service:
Docker build output — dependency installation, compilation, image creation
Production output — your app's stdout/stderr while running in deployment
## Build Logs
Build logs show everything that happens during `docker build`:
* Base image download
* Dependency installation (`npm install`, `pip install`, etc.)
* Code compilation
* Asset bundling
* Any commands in your Dockerfile
### What to Look For
```
Step 1/8 : FROM python:3.12-slim
---> a2c7d3e8f9b1
Step 2/8 : WORKDIR /app
---> Running in 3f4a5b6c7d8e
Step 3/8 : COPY requirements.txt .
---> 1a2b3c4d5e6f
Step 4/8 : RUN pip install --no-cache-dir -r requirements.txt
---> Installing collected packages: flask, click, ...
Successfully installed flask-3.0.0 ...
Step 5/8 : COPY . .
---> 7g8h9i0j1k2l
Step 6/8 : EXPOSE 8080
Step 7/8 : CMD ["python", "app.py"]
Successfully built 3m4n5o6p7q8r
```
```
Step 4/8 : RUN pip install --no-cache-dir -r requirements.txt
ERROR: Could not find a version that satisfies the requirement
nonexistent-package==1.0.0
ERROR: No matching distribution found for nonexistent-package==1.0.0
The command '/bin/sh -c pip install...' returned a non-zero code: 1
```
**Fix:** Check that all packages in `requirements.txt` exist and versions are correct.
### Common Build Errors
```
ERROR: Could not find a version that satisfies the requirement xyz
```
**Fix:** Check package name spelling, version availability, or if it's in a private registry.
```
failed to solve: dockerfile parse error line X: unknown instruction
```
**Fix:** Check Dockerfile syntax. Common issues: typos, missing backslashes in multi-line commands.
```
COPY failed: file not found in build context
```
**Fix:** The file doesn't exist or isn't committed to git. Check the path and make sure it's not in `.gitignore`.
```
npm ERR! code ENOMEM
```
**Fix:** Build needs more memory. Try smaller base images or contact support for larger build instances.
## Runtime Logs
Runtime logs capture your app's output while it's running in production:
* `stdout` — normal output, print statements, info logs
* `stderr` — errors, warnings, exceptions
* Framework logs — web server access logs, database queries, etc.
### Reading Runtime Logs
```
INFO: Started server process [1]
INFO: Waiting for application startup.
INFO: Application startup complete.
INFO: Uvicorn running on http://0.0.0.0:8080
INFO: 192.168.1.1:0 - "GET /api/health HTTP/1.1" 200
INFO: 192.168.1.1:0 - "POST /api/users HTTP/1.1" 201
```
```
INFO: Application startup complete.
ERROR: Exception in handler:
Traceback (most recent call last):
File "/app/routes.py", line 42, in create_user
db.execute(query)
ConnectionRefusedError: Connection refused
ERROR: Database connection failed - is DATABASE_URL correct?
```
**Fix:** Check your `DATABASE_URL` environment variable and database service status.
### Adding Useful Logs
Help yourself debug by adding structured logging:
```python theme={null}
import logging
logging.basicConfig(
level=logging.INFO,
format='%(asctime)s - %(name)s - %(levelname)s - %(message)s'
)
logger = logging.getLogger(__name__)
logger.info("Starting user creation", extra={"user_id": user_id})
logger.error("Failed to connect to database", exc_info=True)
```
```javascript theme={null}
const logger = {
info: (msg, data) => console.log(JSON.stringify({ level: 'info', msg, ...data, ts: new Date() })),
error: (msg, data) => console.error(JSON.stringify({ level: 'error', msg, ...data, ts: new Date() }))
};
logger.info('Starting user creation', { userId });
logger.error('Database connection failed', { error: err.message });
```
Use structured logging (JSON format) for easier searching and filtering. Include context like user IDs, request IDs, and timestamps.
## How Logging Works
**Zero configuration required.** Ardor automatically captures everything your app writes to `stdout` and `stderr`. Just use `print()`, `console.log()`, or your favorite logging library — it all shows up in the logs.
```mermaid theme={null}
flowchart LR
A[Your Code] -->|stdout/stderr| B[Ardor Captures]
B --> C[Log Viewer]
```
## Debugging with Logs
### Startup Issues
App won't start? Check logs in this order:
1. **Build logs** — did the image build successfully?
2. **Runtime logs** — is the app crashing on startup?
3. Look for: missing env vars, connection errors, port conflicts
### Request Failures
API returning errors? Look for:
* Stack traces with line numbers
* Database query errors
* External API failures
* Timeout messages
### Performance Issues
App slow? Look for:
* Long-running queries logged with duration
* Memory warnings
* Connection pool exhaustion
* Rate limiting messages
## Log Best Practices
* **ERROR** — something broke, needs attention
* **WARN** — something unusual, might be a problem
* **INFO** — normal operations, useful for tracking flow
* **DEBUG** — detailed info for debugging (usually disabled in production)
Bad: `"Error processing request"`
Good: `"Error processing request user_id=123 endpoint=/api/orders error=ConnectionTimeout"`
Never log passwords, API keys, or tokens. Mask sensitive data in your logging code.
Generate a unique ID for each request and include it in all logs. Makes it easy to trace a request through your system.
## Troubleshooting
**Cause:** App isn't writing to stdout/stderr, or container isn't running.
**Solution:**
* Make sure your app logs to stdout, not to files
* Check if the container is actually running (deployment status)
* Verify your logging library is configured correctly
**Cause:** Very high log volume or app crashed before flushing.
**Solution:**
* Reduce log verbosity in production
* Flush logs explicitly before app exit
* Check for app crashes in earlier logs
**Cause:** Too many logs, error buried.
**Solution:**
* Use search/filter to narrow down
* Filter by time when the error occurred
* Search for keywords from the error message
## What's Next
Understand the build and deploy process
Test and debug in your dev environment
Configure your app with environment variables
Let Cerebrum help you debug issues from logs